Account Mapping Tools for Technical Sales: 7 Options and the Team Each One Misses



Whether they sell B2B solutions or children’s toys, smart marketers know that identifying the most influential parties in the decisionmaking process means looking past formal hierarchy. Rarely is this truer than in technical sales, where niche departmental knowledge, testing requirements, and the demands of vertical integration render org charts all but useless.
Fortunately, account mapping tools allow B2B sales teams to bypass surface signals to look at the informal network – or buying group – that really governs power in organizational purchasing decisions. But even the most well-established tools vary wildly in their depth of analysis, automation, and available data. In this article, we’ll take a closer look at what these tools do, how their capabilities differ, and how to choose the right solution for your team.
What Is an Account Mapping Tool?
Account mapping tools are software that reveal the informal relationships and roles in organizations that influence buying decisions – otherwise known as the buying group.
Typically, account mapping tools rely on a combination of first and third party data to complete a “map” that categorizes individuals across four layers:
- Stakeholders: Who is likely to influence the purchasing decision, and what are their formal roles?
- Buying committee roles: In what ways are these individuals likely to shape the buying decision? Will they test the demo, issue final approval, or champion the product at significant meetings?
- Relationships: What hierarchies and other relationships exist between these individuals, and what connections exist between them and your sales team? What are the warmest points of contact?
- Influence: Where does hidden influence reside for each potential sale? Are there unexplored areas of “white space” that your team can exploit?
Modern AI-powered tools should give you not just the buying group, but specific pressure points within that group that can be targeted in distinct ways to secure conversions. This differentiated strategy is more essential than ever because buying groups are increasing in size; Forrester reports that the average buying group now numbers 13 internal stakeholders and 9 external influencers, making it all the more difficult to locate points of power without the help of custom software.
X Marks the Spot: Not All Maps Should Be Equally Treasured
Many tools derive basic account maps from surface signals like LinkedIn profile information and internal data such as whitepaper downloads and webinar attendance. However, these results often simply reproduce the buying committee – rather than the buying group – and remain relatively static over time due to limited data input.
Fortunately, smart account mapping tools can bypass these issues using a combination of intelligent automation and both internal and third-party data sources – such as community activity, CRM data, and open source interactions. Ideally, real-time data signals from these diverse sources undergo continuous deanonymization and entity resolution processing to reveal a dynamic, multidimensional grid of power relationships entirely independent from job titles. Let’s take a look at how Onfire achieves this:
How We Handle Account Mapping at Onfire
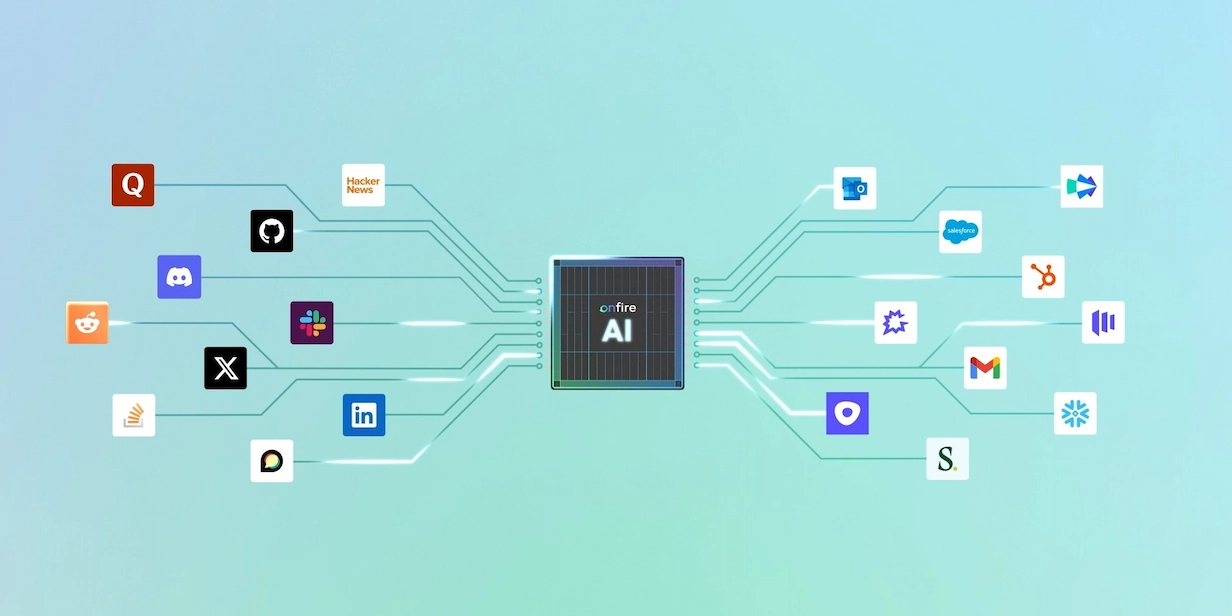
Onfire’s account mapping software compiles insights from a huge array of internal and external data sources, before its advanced automation system parses the information into a dynamic map. This detailed blueprint breaks down formal and informal power structures, key pressure points, and even provides tailored messaging points geared to earn warm reactions from specific contacts.
Behavior-First
Onfire begins from a point of title-agnosticism, prioritizing provable behavior over formal roles. Rather than filter for “Senior Software Engineer”, you define the personas that drive your deals (eg. “the engineering lead responsible for CI/CD”) and Onfire finds the people who match them.
Its knowledge graph maps technologies to the specific teams and individuals who run them, so the result is the person who owns the system you integrate with – and not simply everyone in Engineering.
Technical Champions and Economic Buyers
Technical deals usually depend on two people above all others: a champion, who cares most about the problem and will sell on your behalf, and an economic buyer, who controls the budget. These are rarely the same person, and usually unidentifiable from an org chart. Onfire locates both, and shows how each connects to the rest of the buying group.
The Full Picture of the Engineering Team
Onfire combines signals that most data providers can’t track – open-source contributions, discussions in developer communities, conference attendance, and job moves – with first-party data like product usage, CRM history, and notes from previous sales calls. Each signal is resolved to a named person and team, so a pseudonymous Reddit question, a free-tier signup, and a recent hire can all be traced back to the same project. Importantly, your first-party data is only ever used for your own account.
From Map to Outreach
A map is only useful if your team can act on it. For each person, Onfire surfaces relevant messaging points based on what they’ve worked on or asked about, warm intro paths through shared connections, and background information such as the talks they’ve given, articles written, and the events they’ve attended.
7 Alternatives for Account Mapping – and What They Miss
Most account mapping tools handle some parts of the job well, while other aspects fall by the wayside. We’ve compared some of the most popular options below, highlighting what we’ve found to work, and what misses the mark.
LinkedIn Sales Navigator (Relationship Map and Relationship Explorer)
Sales Navigator’s Relationship Map lets reps chart reporting lines, tag people with one of five buying roles, and spot warm paths through shared connections, while Relationship Explorer suggests further contacts. All data comes from LinkedIn and reps build each map by hand, up to a limit of 10 maps of 30 leads each. Core costs $119.99 and Advanced $159.99 per month, billed monthly.
The team it misses: anyone whose title doesn’t reveal their role, or isn’t on LinkedIn – and 30 cards can’t hold an org where everyone is “Software Engineer”.
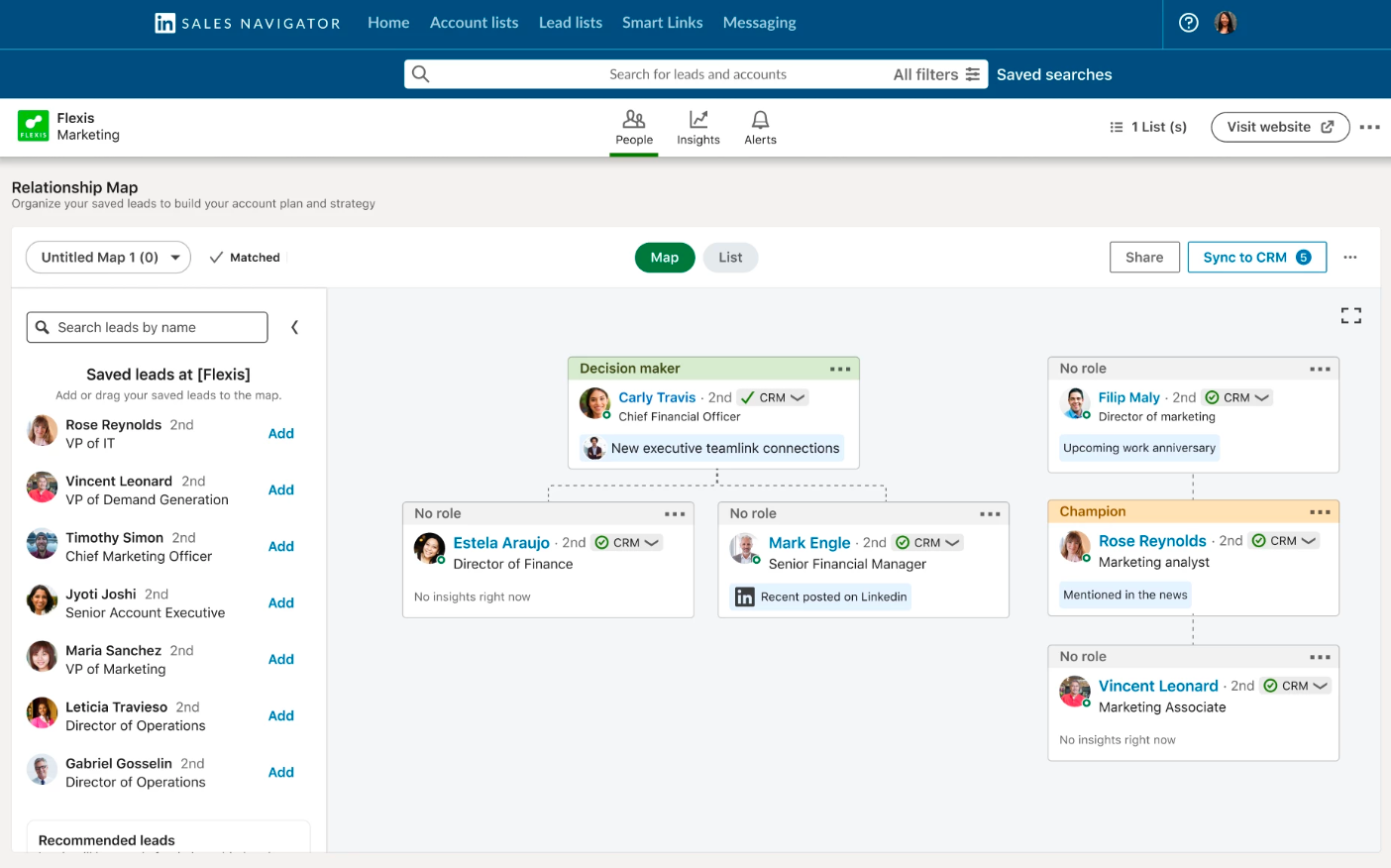
Image source: LinkedIn Sales Community
HubSpot Buying Groups
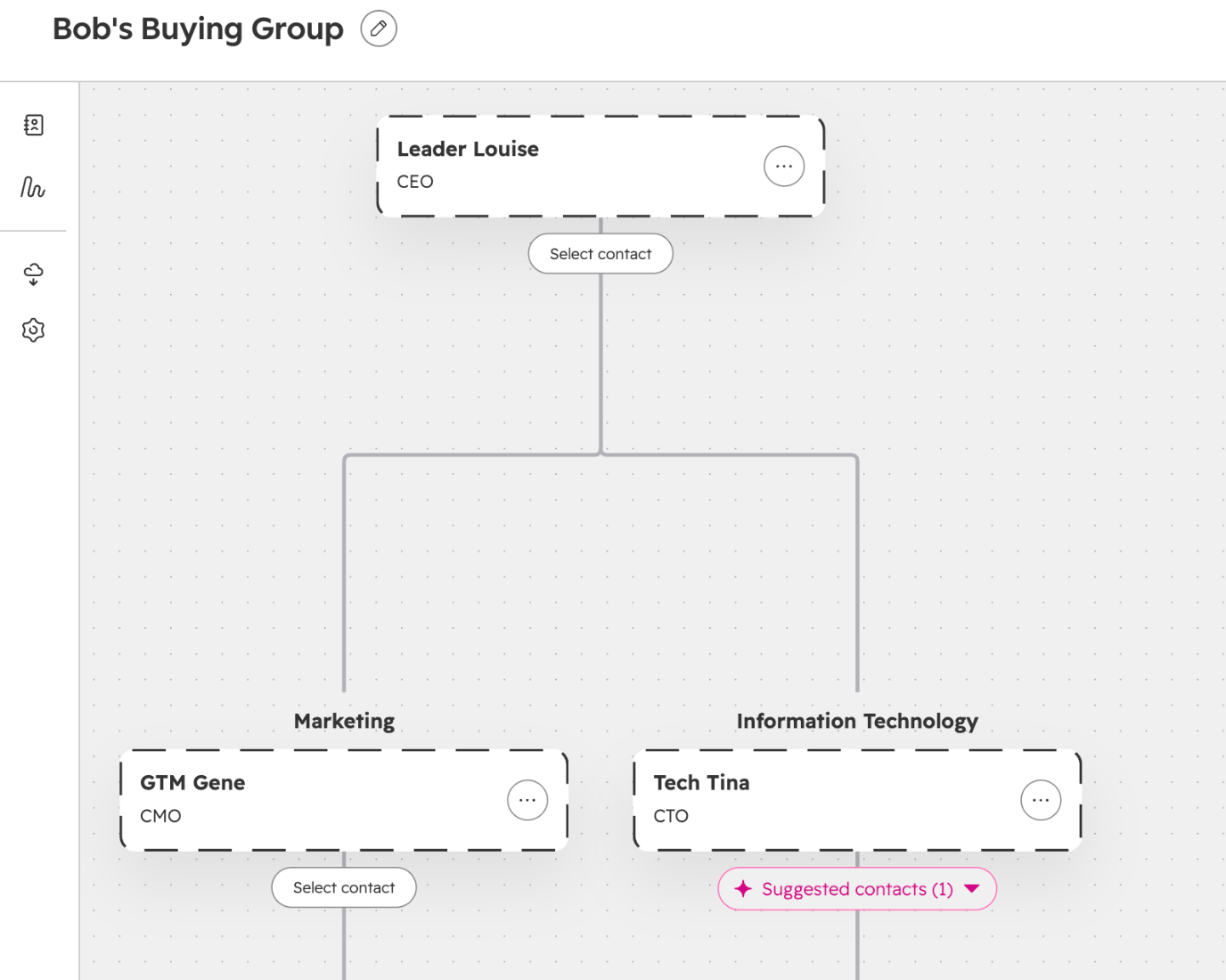
Currently in beta, HubSpot Buying Groups displays an org chart, buying roles, and an activity heatmap for each account. It works from the contacts already in your CRM, supplemented by AI suggestions based on job titles. It’s available on Sales Hub Professional ($90) and Enterprise ($150), per seat per month.
The team it misses: anyone who isn’t already in your CRM.
Source: HubSpot Knowledge Base
Salesforce Account Plans (Buyer Relationship Map)
Salesforce’s Account Plans include a Buyer Relationship Map that groups stakeholders by department and seniority. It uses your Salesforce contacts, with fields completed by an LLM, and is included at no extra cost in Enterprise edition and above.
The team it misses: those inside “Engineering” – its department groups put every engineer in the same bucket.
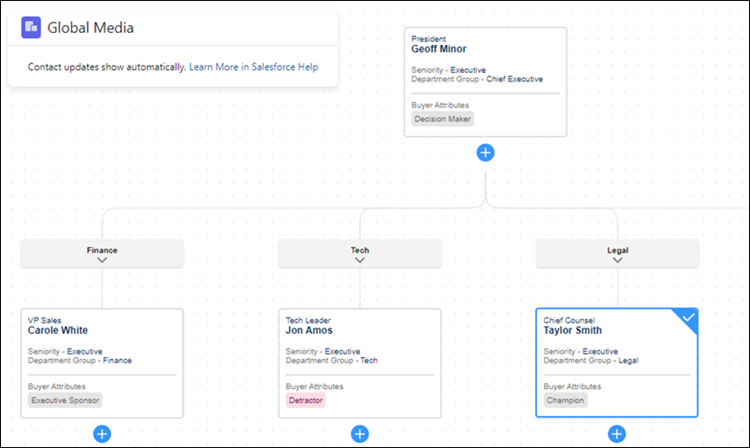
Image source: Salesforce help
Altify Relationship Map
Altify maps decision makers, blockers, informal influence, and coverage gaps, making it one of the more politically nuanced tools on this list. However, it depends entirely on the Salesforce contacts your reps enter. Pricing is available on request.
The team it misses: the technical one – it claims to show who holds influence, but sheds no light on what each team runs.
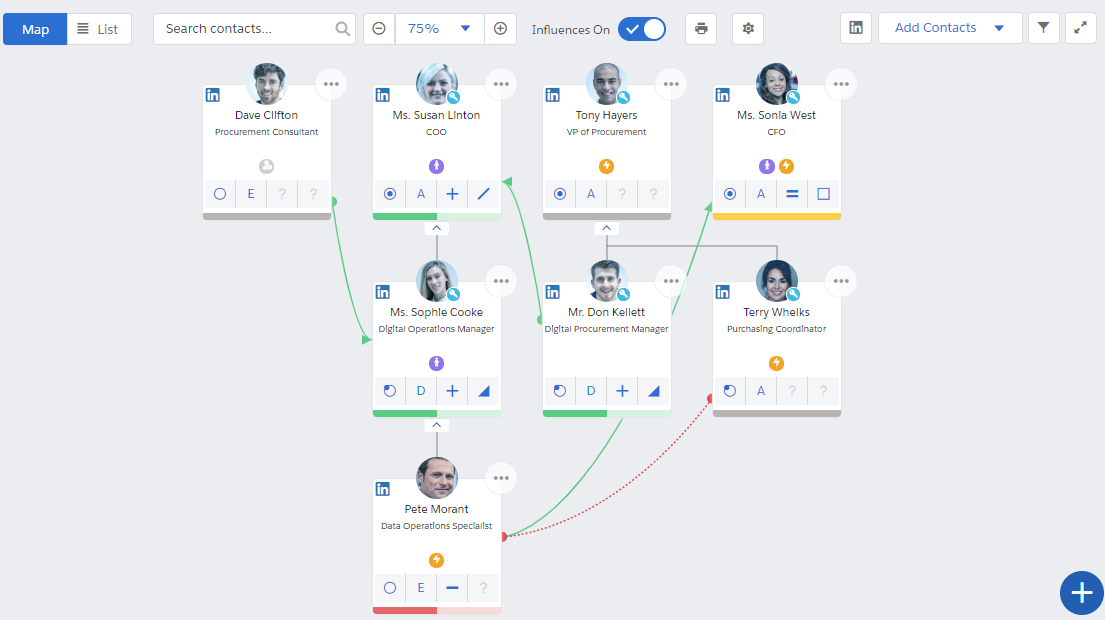
Source: Upland Altify Help
The Org
The Org publishes public org charts and team pages, compiled from company websites, news, LinkedIn, and crowdsourced edits. A free plan includes 10 credits per month, while Basic costs $232 and Premium $392 per seat per year.
The team it misses: anything smaller than a department, since teams appear as broad buckets (such as “Engineering and Development: 8,780 people”).
Gong (Deal Board Contacts Tab)
Gong’s Deal Board shows who is engaged on both sides of a deal, and recommends further contacts by title. It draws on calls, emails, and CRM data, which boosts accuracy regarding active conversations. Pricing is available on request, and the feature requires a Forecast licence.
The team it misses: anyone who hasn’t yet appeared on a call or an email thread.
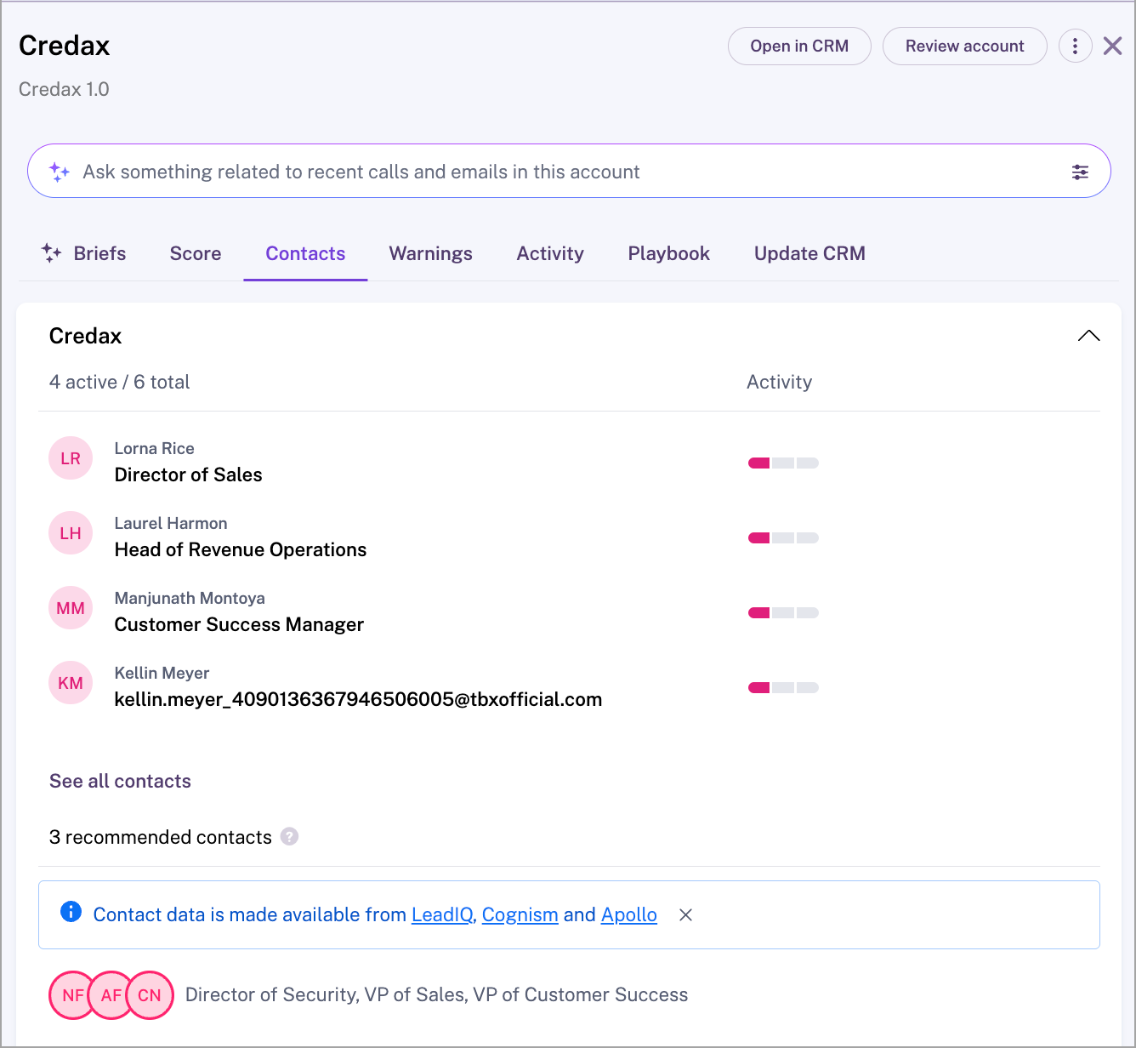
Source: Gong Help Center
Claude with Web Search
Claude can infer an account’s hierarchy and roles from the public web, and even draw the result as an org chart. It’s available on every plan, including Free, with Pro costing $17 per month billed annually.
The team it misses: anyone it can’t verify – it has no people data of its own, rebuilds each map from scratch, and every name needs checking.
Account Mapping Tools Compared
The Layer Underneath: Mapping Teams by What They Run
Unlike most industries, account maps for technical sales must pay more attention to systems than people: which team runs which part of the stack, what they’re migrating towards, and where the friction is. Once that layer is in place, the people follow naturally, because you know which team owns the problem your product solves.
Onfire’s knowledge graph connects stack, teams, and people, with evidence for every link. It’s delivered into your CRM, and into Claude through the Onfire MCP connector – so a rep can ask: “Which team at this account runs Kafka, and who should I speak to first?” and get an answer grounded in evidence rather than guesswork.
Want to see Onfire account maps in action? Book a demo today.
FAQs
What is account mapping in sales?
Account mapping is the process of charting the people, roles, and relationships inside a target account, in order to understand how buying decisions are actually made. A good map captures informal influence that an org chart fails to show.
What’s the best account mapping tool for technical sales?
For technical sales, the best tool is one that maps teams by what they run, not just people by title. Onfire is expressly designed for this, combining diverse technical signals with your first-party data to identify champions, economic buyers, and other informal roles across engineering teams.
Can LinkedIn Sales Navigator map an account?
Yes. Its Relationship Map lets reps chart reporting lines, assign buying roles, and find warm paths. However, it relies exclusively on LinkedIn data and job titles, while each map is built by hand and capped at 30 leads.
What’s the difference between account mapping and partner account mapping?
Account mapping charts the people and relationships inside a single target account. Partner account mapping compares your customer and prospect lists with a partner’s, in order to find overlapping accounts and opportunities for co-selling.